The Weizmann Institute of Science Martin S. Kraar Observatory participates on a regular basis in the μFUN project, the Microlensing Follow-Up Network, a network of a dozen observatories, mainly in the southern hemisphere, which collaborate in an effort to detect exoplanets (planets revolving around stars other than our Sun) around stars residing in the bulge of our Milky Way galaxy, using a technique called gravitational microlensing.
From the beginning of spring and continuing till the end of autumn, the uFun central node at OSU circulates messages to participating observatories about potential events. Targets which are bright enough are imaged for a full night or more.
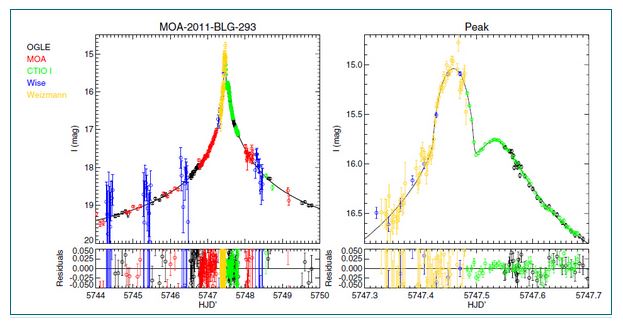
A microlensing event usually requires the combined efforts of several observatories to record its full span. On July 4th, 2011, we were in the right location and at the right time to record such an event, the peak of which took place during our ‘shift’. Thus we were able to register uniquely the telltale signatures of a planet when its host star went through a microlensing event.
The resulting paper, titled MOA-2011-BLG-293Lb: A Test of Pure Survey Microlensing Planet Detections, accounting this discovery and providing details about the participation of the Weizmann Institute of Science Martin S. Kraar Observatory in the global observing campaign, which culminated in the discovery of an exoplanet.
Following is a triplet of small sections of the images taken at different times during the event, with the discovery clearly marked. The increase in the luminosity of the star marked is due to the gravitational amplification of its light by a gravitational lens, composed of a star+planet system. (Click on the image to open a larger frame):
Below is a light curve of the microlensing event of MOA-2011-BLG-293. The left-hand panel shows a broad view of the light curve, while the right-hand panel highlights the peak of the event where the planetary perturbation occurs. Data from different observatories are represented by different colors, where the WIS MKO contribution to this discovery is in yellow, indicating observation at the exact time of planetary transition. The black curve is the best-fit model with a close topology (s < 1). The times are given in HJD’ = HJD−2450000:


