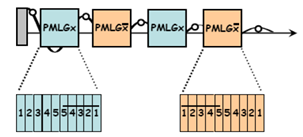
The phases of the pulses are given by  , where i is the pulse number varying between 1 ≤ i ≤ n and here n = 5.
The parameters that need to be optimized when setting up the experiment are – tp (the individual pulse's length), ν1 (the RF amplitude), w (the window's length) and the RF offset.
Optimization should be done on a model compound, such as glycine. It's best to work with a sample confinde to the center of the rotor by the spacers.
The steps are:
- Choose the MAS frequency for the experiment (10kHz is usually good enough, but the experiment was tested and can be used with up to 65kHz).
- For 10kHz MAS, start with tp between 1.2-1.5μs. In any case you should avoid setting
 with |n|=1,2,3,4 and integer k (τr is the rotor cycle).
 - Set the RF amplitude slightly higher than the LG condition,
 (pulse length in μs and RF in kHz).
 - Set the window length as short as your probe is capable of without getting artifacts into the spectrum.
- Set the RF offset close to the spectral lines.
- If you're getting spikes on your spectral lines, slightly modify the length of the pulses until you see the spikes move further away. When you get a clean spectrum stop modifying tp.
- Adjust the RF amplitude and the RF offset for best resolution.
If you used glycine sample you can asses the performance by maximaizing the splitting between the two aliphatic sites.
Once you are happy with your result you can put your sample and vary only the RF offset, the rest of the parameters should stay the same.
If you modify the MAS frequency you have to repeat the steps on the model compound.
Determining the scale factor
With the super-cycled wPMLG scheme the scale factor should be constant and independent of the RF offset. This can best be varified by applying the optimised scheme on adamantane as a function of the RF offset.
The steps are:
- Detemine the on-resonance frequency of adamantane, νRF-ada, from a single 90 pulse experiment (figure a).
- Use exactly the same parameters you used for the super cycled wPMLG experiment on your sample, on adamantane. Acquire the spectra as a function of the RF offset (scan a range of at least 5kHz above and below the line). An example is plotted in figure b (spectra in magnitude mode).
- Extract the line position as a function of the RF offset νRF, make sure the frequency scale is in kHz and centered around zero. Plot these values (defined as Δν) as a function of the non scaled Δν0, this can be determined from the difference νRF - νRF-ada. You should get something similar to figure c.
- Fit the data with a linear line as
Δν = s * ( Δν0 ) + ε
when s is the scale factor and ε is the residual contribution coming from RF imperfections. - Now you can calculate the ppm scale for the wPMLG spectrum of your sample by:
ν[ppm] = { ( Δν - ε ) / s + νRF - νRF-ada } * 1000 / ν0 + 1.8
Here all the terms in the curly brackets should be in kHz and ν0 is the 1H Larmor frequency in MHz. 1.8 is added as the chemical shift of adamantane.
Although it's a bit tedious, the scale factor can be determined most accurately this way. A shorter alternative (recommended only if you've verified you have a constant scale factor all over your spectral window as in figure c) is to determine the scaling equation in (4) from the scaled positions of the glycine lines compared to their non-scaled positions, known from their isotropic chemical shifts. You can also determine it from two adamantane wPMLG spectra acquired with different offsets.

For questions or clarifications, please contact Michal Leskes: michal.leskes@gmail.com


