Structure, Dynamics and Electrostatics of the
L-Asparaginase Catalytic Centre:
Implications for Reaction Mechanism
Clare E. Sansom 1,2 and Mariusz Jaskolski 1,3
1: Center for Biocrystallographic Research, Polish Academy of Sciences, Poznan, Poland
2: Department of Biochemistry and Molecular Biology, University of Leeds, Leeds,
UK
3: Department of Crystallography, Adam Mickiewicz University, Poznan, Poland.
CES now at: Department of Crystallography, Birkbeck College, London, UK
and Venus Internet Ltd., London, UK. Email:
c.sansom@mail.cryst.bbk.ac.uk
L-Asparaginases catalyse the hydrolysis of L-asparagine into L-aspartate and ammonia.
The asparaginases isolated from Escherichia coli (EcA) and Erwinia
chrysanthemi (EcA) are useful anti-leukaemic agents [1].
Asparaginase treatment can be associated with severe side effects, which are
believed to be associated with their glutaminase activity [2].
In order to be able to "engineer out" this unwanted glutaminase activity, and
increase asparaginase affinity (which is a hallmark of therapeutic value in
bacterial asparaginases), it is necessary to understand fully the structure and
mechanism of this enzyme.
The precise mechanism of L-asparaginase action is still unknown, although
hydrolysis is known to proceed in two steps via a beta-acyl-enzyme intermediate.
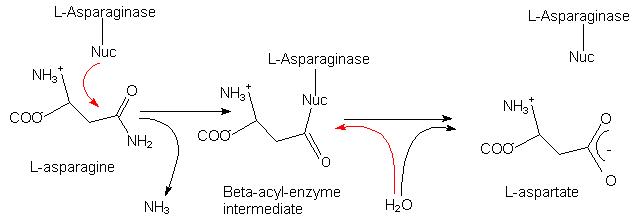
Fig. 1: Schematic illustration of the reaction mechanism of L-asparaginases.
The proposed covalent intermediate is formed through nucleophilic attack by the
enzyme.
Red arrows indicate nucleophilic attack.
 Top of poster
 Next section
The crystal structures of both EcA [3] and ErA
[4] are known. Both these enzymes are active as
homotetramers; each has a monomer of about 330 amino acids with a two-domain
fold. Both domains fit into the alpha / beta class; the larger N-terminal
domain contains an unusual left-handed beta-alpha-beta crossover similar to that
found in flavodoxin, which forms a "cradle" for the active site.
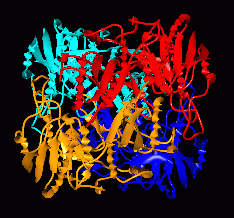
Fig. 2: 222-symmetric tetrameric structure of L-asparaginase II (periplasmic)
from Escherichia coli
Click the image to enlarge.
Click here to retrieve the PDB file:
3ECA.PDB
Click here to retrieve the SWISS-PROT entry:
ASG2_ECOLI
The tetramer consists of a pair of dimers, each with an extensive dimer interface:
it can be described as a dimer of "intimate dimers" (red/gold and blue/cyan in Figure 2).
Each "intimate dimer" contains two active sites, and each active site contains
some residues from both monomers in the intimate dimer. The crystal structure of
EcA contains four molecules of L-aspartate (the product of the "forward" reaction,
or the substrate for the "reverse" reaction), one bound into each active site.
Two threonine residues - T12 and T89 in EcA - which are conserved throughout the
L-asparaginase family, and are known to be essential for activity, lie close to
the bound aspartate. These threonines are both able to act as primary nucleophiles.
They are both necessary for activity, and neither kinetic nor structural data has
yet been able to show which is the most likely primary nucleophile.
Fig. 3: "Intimate dimer" of EcA, showing L-aspartate (cyan, van der Waals
representation) bound in each of the equivalent active sites.
Click the image to enlarge.
The crystal structure of the inactive T89V mutant has recently been solved
[5]. It has been modelled and refined with
the aspartate ligand covalently bound to T12 through its side chain carboxy
group, in a structure which may resemble an acyl-enzye intermediate. This
indicates at least that T12 may act as the primary nucleophile, although
this activity may be caused by the lack of a nucleophilic group on residue 89.
Top of poster
Next section
All calculations were performed using Discover v.2.95, by MSI (formerly Biosym)
[6]. The "intimate dimer" formed by chains A and
C, with one molecule of aspartate bound into each active site, was extracted
from the PDB file 3ECA.PDB [3]. The system was
modelled using the CVFF force field, and solvent was modelled using a distance
dependent dielectric. In each active site, the water molecule directly
hydrogen-bonded to the aspartate was included in the model.
In normal circumstances, all lysine residues are protonated - i.e. they carry a
total charge of +1. They only become deprotonated under extreme
(non-physiological) conditions. Some people believe that Lysine 162 in
L-asparaginase (one of the residues in the proposed catalytic triad T89-K162-D90,
which is reminiscent chemically and structurally of the S-H-D catalytic triad in
serine proteases) could be deprotonated in the active enzyme. A neutral lysine
here may be able to promote the action of T89 as a nucleophile. However, to fit
in with the known normal pH conditions for the enzyme activity, Lysine 162 was
modelled as protonated.
The system was subjected to 500 cycles of energy minimisation using steepest
descents, followed by 2000 cycles using conjugate gradients. For these preliminary
calculations, 25 ps of molecular dynamics was carried out at 300K, starting from
the minimised structure.
The minimisation and dynamics were repeated using an intimate dimer of the T89V
mutant structure [5] as the starting model.
Coordinates were kindly provided by A. Wlodawer (PDB entry code will be 1WSA).
Top of poster
Next section
During the dynamics run, as expected, most of the scaffold of the active site
and many secondary structure elements remained fairly inflexible; there was much
more movement in the surface loops. Only one of these loops is important for
the catalytic mechanism: the loop bordered by the essential residues T12 and Y25.
This loop acts as a "cap" for the active site, and the angle it makes with the
active site scaffold is seen to fluctuate during the simulation.

Fig. 4: Alpha-carbon trace of a single monomer of L-asparaginase, showing
eight "snapshots" taken from the dynamics simulation at 2ps intervals. The loop
which acts as a "cap" for the active site is shown in magenta.
Click the image to enlarge.
After minimisation, the side chain carboxylate group of each aspartate remained
in close contact with the side chains of both T12 and T89 in the respective
monomer, implying strong polar interactions. During the dynamics simulation,
these potential aspartate-threonine hydrogen bonds were in rapid exchange, with
each potential hydrogen bond breaking and re-forming over a timescale of a few
picoseconds.
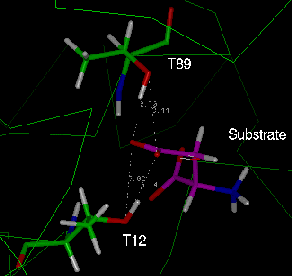
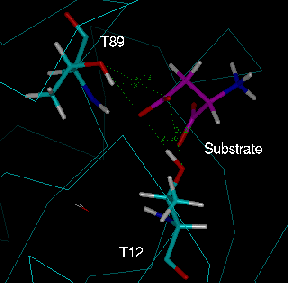
Fig. 5: The two equivalent active sites of the L-asparaginase dimer after
energy minimisation. In each case the side chain carboxyl group of the
aspartate (labelled "substrate") is in close contact with the hydroxyl groups of
both candidate nucleophiles, T12 and T89. Green: "active site 1" (chain A);
cyan: "active site 2" (chain C).
Click the images to enlarge.
Click for dynamics animations (c.225Kb):-
Animate active site 1
Animate active site 2
In "active site 1", the side chain carboxylate group remained bound to the active
site threonines throughout the simulation, although it was bonded to A89 for a
higher percentage of the time than to A12. However, in "active site 2", the
aspartate molecule "flipped over" during the simulation, so that the main chain
carboxyl group occupied an equivalent position to the side chain carboxylate in
active site 1. The fact that this gross change in orientation was possible
(without a significant increase in energy) indicates the relatively large size of
the active site and the number of quasi-equivalent low energy positions that it
must be possible for the substrate to adopt.
The dynamic exchange between hydrogen bonds can be seen clearly in graphs of
intermolecular oxygen-oxygen distance against time: for
active site 1 and for active site 2
T89V Mutant
The crystal structure of the T89V mutant [5] showed
a close contact between the aspartate ligand and the remaining nucleophile, T12,
which has been modelled as a covalent (ester) linkage. This covalent bond
obviously restricted the movement of the ligand within the active site.
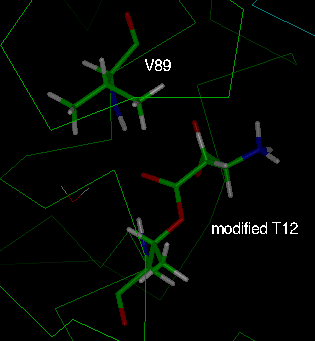
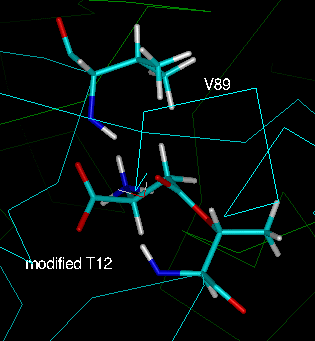
Fig. 6: The two equivalent active sites of an intimate dimer of the
L-asparaginase T89V mutant after
energy minimisation. The aspartate is bound to T12 through an ester linkage
(labelled "modified T12"). Green: "active site 1" (chain A);
cyan: "active site 2" (chain C).
Click the images to enlarge.
In one active site, the "side chain" carbonyl group of the bound aspartate moved
away from the hydrophobic side chain of the mutated residue V89. In the other,
this group remained less than 5.5A from the valine side chain throughout the
simulation. This difference is clearly seen in graphs
of oxygen-carbon distance against time.
The Electrostatic Environment of the Active Site
The electrostatic potential of EcA was calculated using Delphi
[6]. The minimum-energy conformation of the
enzyme was used, with the asparates removed (to give the apo form of the
enzyme).
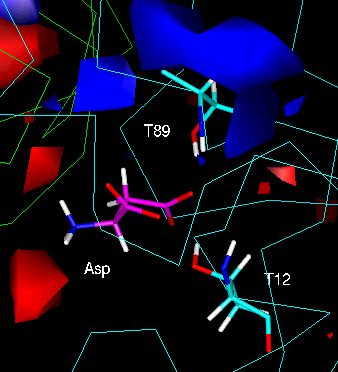
Fig. 7: Electrostatic environment of "Active Site 2" (nomenclature as above);
the red contour is drawn at a potential of -80 "potential units" (kT/A) and the
blue contour at a potential of +80 potential units. The aspartate ligand (C
atoms magenta) was superimposed in its minimum-energy conformation.
Click the image to enlarge.
The most significant feature of the potential map of the active site cleft would
seem to be small lobes of extremely high negative potential (red) close to the
charged amino end of the aspartate. This may explain why this group acts as a "pivot"
during the flip of the aspartate carboxyl groups, remaining fairly close to its
original position throughout the dynamics run. This is quite clearly seen in the
animation of this active site.
Top of poster
Next section
- During the minimisation and dynamics of the wild type enzyme, the two
candidate nucleophiles T12 and T89 behave in an equivalent manner. There is
no evidence from the dynamics that either residue is more likely to act as the
primary nucleophile in active L-asparaginase.
- Even though the geometry of the interactions between the threonine hydroxyls
and the aspartate carboxyl group seems to prevent the formation of proper hydrogen bonds,
the intermolecular O...O distances are very short, indicating strong attractive
electrostatic interactions.
- With K162 protonated, there is no evidence of a proton-abstracting promoter
group close to either candidate nucleophile. The calculations for the wild type
enzyme will be repeated with K162 unprotonated. This chemically unusual
situation, which may occur in active L-asparaginase, would provide a promoter for
nucleophilic activity of T89.
- The active site cavity is quite large, and substrate movement within it is not
restricted, probably due to the flexibility of the loop (delimited by T12 and Y25)
which "caps" the active site. This opens and shuts during the simulation. The size
of the active site cavity is best illustrated by the "flip" of one aspartate,
which exchanges the position of its two carboxylate groups. However, despite
this potential freedom of movement, one or the other carboxylic group remains
"wedged" between the hydroxyl groups of T12 and T89 during most of the
simulation.
- In order to assess fully the equivalence of the two possible covalent
intermediates, which would be expected to result from T12 or T89, respectively,
functioning as the primary nucelophile, it will be necessary to repeat the
calculations using a T12V mutant structure. Preliminary crystallographic
analysis of this mutant structure is currently underway in Alex Wlodawer's lab
at the NCI, Frederick, MD, USA.
- Another feature of this type of enzyme reaction mechanism - which is also
found in the serine protease family - is an "oxyanion hole" which helps stabilise
the tetrahedral transition state during nucleophilic attack. The location of
the oxyanion hole depends on the relative locations of the substrate and the
primary nucleophile. Further electrostatic analysis of these structures may be
required to enable us to determine whether such a hole would be formed on either
side of the active site.
Top of poster
Next section
- J. M. Hill et al. (1967). J. Am. Med. Assoc. 202, 882-888.
- J.A. Distasio et al. (1982). Int. J. Cancer 30, 343-347.
- A.L. Swain et al. (1993). Proc. Nat. Acad. Sci. USA 90, 1474-1478.
- M. Miller et al. (1993). FEBS Letts. 328, 275-279.
- G.J. Palm et al. (1996). FEBS Letts. 390, 211-216.
- Insight II v. 2.3.0 and Discover v. 2.95. (1994). Molecular Simulations Inc.,
San Diego, CA, USA.
Top of poster