Functions of saccades and drifts

During natural viewing large saccades shift the visual gaze from one target to another every few hundreds of milliseconds. The role of microsaccades (MSs), small saccades that show up during long fixations, is still debated.
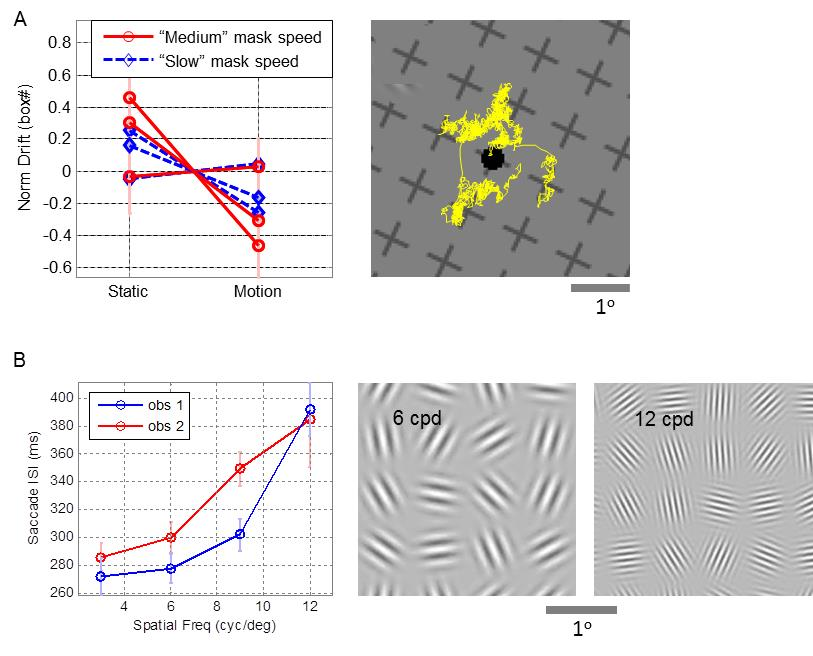
A major debate is whether MSs are used to redirect the visual gaze to a new location or to encode visual information through their movement. We argue that these two functions cannot be optimized simultaneously and present several pieces of evidence suggesting that MSs redirect the visual gaze and that the visual details are sampled and encoded by ocular drifts. We show that drift movements are indeed suitable for visual encoding.
Yet, it is not clear to what extent drift movements are controlled by the visual system, and to what extent they interact with saccadic movements. We analyze several possible control schemes for saccadic and drift movements and propose experiments that can discriminate between them. We present the results of preliminary analyses of existing data as a sanity check to the testability of our predictions.
Relevant papers
-
(2001). Figuring space by time. Neuron. 32:185-201. (Review)
-
(2012). Seeing via miniature eye movements: a dynamic hypothesis for vision. Frontiers In Computational Neuroscience. 6.
-
(2016). On the possible roles of microsaccades and drifts in visual perception. VISION RESEARCH. 118:25-30.
-
(2015). 1-D Vision: Encoding of Eye Movements by Simple Receptive Fields. PERCEPTION. 44:986-994.
Local drift speed

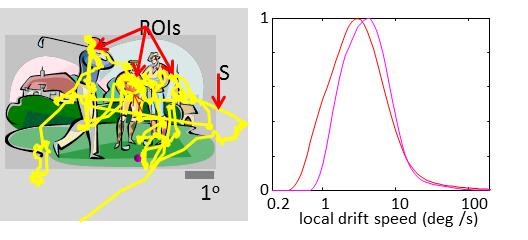
Data presented for 2 experiments:
In Exp1 (red curve, 5 subjects, total 797 s, eyeM sampling at 250 Hz, viewing distance 0.45 m) observers fixated on a stationary cross (0.6 x 0.6 deg) with a dynamic background (14.8 x 14.8 deg of a random dot stereogram whose dots fluctuated at 120 Hz);
in Exp 2 (magenta, 4 subjects, total 315 s, eyeM sampling at 500 Hz, viewing distance 0.6 m) observers viewed at fixation 1-Hz-flashing Gabor patches (3 cyc/deg and envelope of 4 cycles, with random contrast of 7 logarithmic levels in the range 0.8%- 50%). Histogram curves were smoothed). These speeds are larger than previous estimations (e.g., 1 deg/s, Cherici et al 2012) because here we computed the derivative of the raw, non-smoothed eye-positiondrift signal, assessing the local speed by which a stimulus crosses the RF.
Technically, as the relevant time window for estimating sRF responses is in the order of 1 ms, no smoothing is allowed for data sampled at intervals larger than 1 ms, as is the case here. The down side here is that our data unavoidably contain measurement noise which inflates our distributions. Hence, the upper side of each distribution (Fig. 2B) should be taken as an upper bound for local drift velocity in that experiment.
Relevant papers
-
(2001). Figuring space by time. Neuron. 32:185-201. (Review)
-
(2012). Seeing via miniature eye movements: a dynamic hypothesis for vision. Frontiers In Computational Neuroscience. 6.
-
(2016). On the possible roles of microsaccades and drifts in visual perception. VISION RESEARCH. 118:25-30.
-
(2015). 1-D Vision: Encoding of Eye Movements by Simple Receptive Fields. PERCEPTION. 44:986-994.


